Using Python in Excel offers a powerful tool for efficiently analyzing complex datasets. To effectively utilize Python in Excel, it’s crucial to grasp the basics of how Python interacts with Excel data sheets. This understanding begins with simple operations like adding numbers.
In Python for Excel, interactions with Excel table data are managed through dataframes. Regardless of the data size, be it a single number or a larger set, you need to create a dataframe for it. Fortunately, creating a dataframe is a swift process and generally isn’t a concern unless dealing with thousands of them.
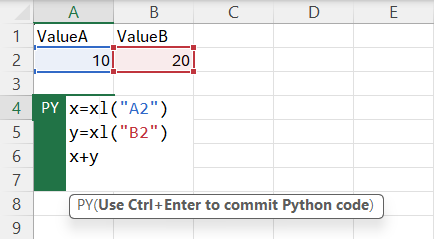
The creation of dataframes in Python for Excel is achieved using the xl() command. This function requires an initial parameter: the Excel data range for which you want to create the dataframe. For instance, to create a dataframe for a single cell, you would use the cell’s name as the first parameter, like xl("A2"). For a range, you would specify it in the same way as you would in Excel formulas. Conveniently, ranges can also be selected directly from the Excel sheet.
Consider the example below, where two dataframes are initialized: one for the A2 cell and another for the B2 cell. These dataframes, referred to as x and y, are then added together. In Python for Excel, when there’s no explicit assignment operation, the system assumes the value to be the return value of the current formula. Hence, in our example, the sum of x and y is calculated and displayed in the Python for Excel cell.