In the context of using Python with Excel, the DataFrame is a crucial data object. It essentially represents a table, capable of being formed either from Excel spreadsheet data or from calculations executed by Python within Excel.
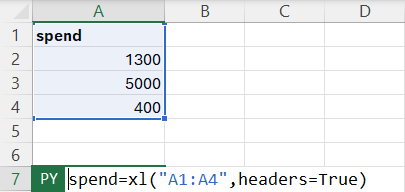
An example demonstrates the creation of a DataFrame from an Excel spreadsheet. The process involves the xl() command, which requires two parameters. The first parameter is a range of Excel cells, like “A2:A4”, and the second parameter includes options for the DataFrame. In this instance, the command is spend=xl("A2:A4", headers=True), indicating that the DataFrame should be created from the cell range A1:A4, with the first row serving as the header.
Once the DataFrame is established, basic manipulations can be performed. For example, to aggregate values in the ‘spend’ column, the following code is used:
spend = xl("A1:A4", headers=True)
s = spend.sum(axis=0)
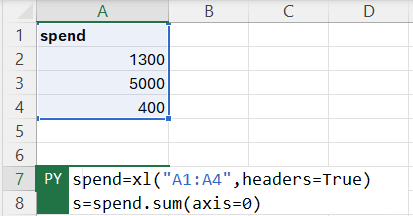
By pasting this code into the Python for Excel formula, the cell is marked as a DataFrame, indicating its creation and availability for use.
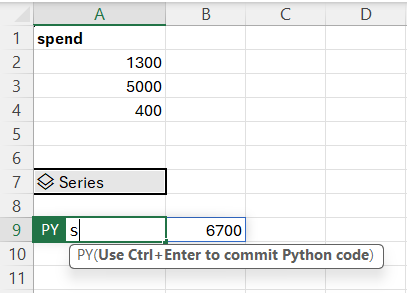
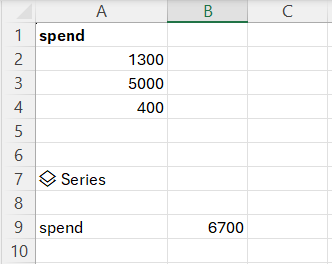
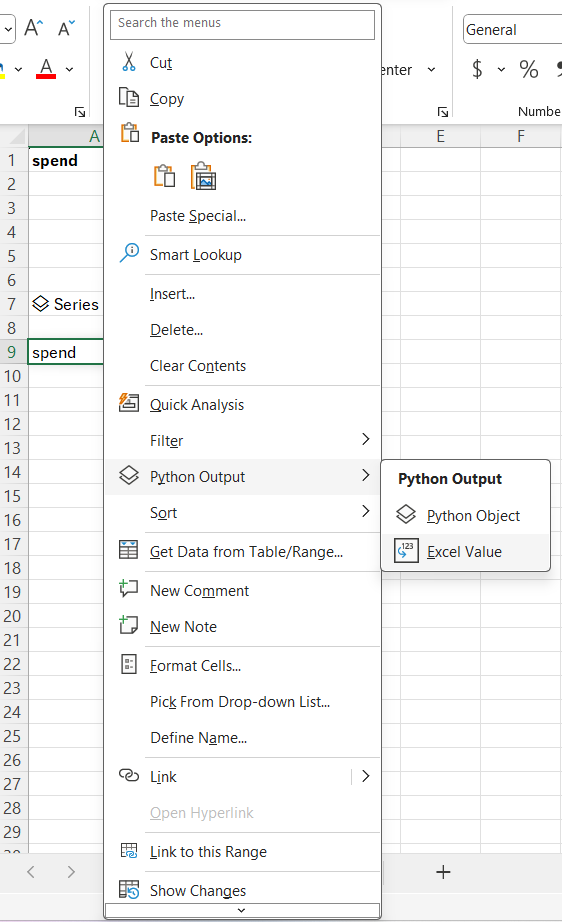
To display the output of this DataFrame, simply type s into another Python for Excel formula cell. To ensure that the data from the DataFrame spills over into other Excel cells, it’s important to select “Python Output -> Excel Value” in the popup menu for the Python DataFrame cell.
Lastly, to see the sum of ‘spend’ displayed and to initiate recalculation, it’s necessary to press Ctrl+Enter after completing the Python in Excel formula.